Youtube Stats Analysis
Mon 30 June 2025
import pandas as pd
import matplotlib.pyplot as plt
import seaborn as sns
df = pd.read_csv(r'C:\datasets\youtube_stats.csv')
df
| Title | Views | Likes | Comments | Duration | |
|---|---|---|---|---|---|
| 0 | Study Vlog - 1 | 254300 | 15300 | 1893 | 12:30 |
| 1 | How to Focus Better | 431000 | 28500 | 3045 | 10:45 |
| 2 | Python for Beginners | 891000 | 76000 | 4589 | 25:00 |
| 3 | Room Tour 2025 | 123000 | 8200 | 1203 | 8:00 |
| 4 | Study With Me - 2hr Pomodoro | 710000 | 54200 | 3421 | 120:00 |
| 5 | My Daily Routine | 276500 | 17400 | 2145 | 9:50 |
| 6 | Productive Morning Routine | 389000 | 23800 | 2801 | 11:00 |
| 7 | Q&A: Student Life | 194000 | 12200 | 1645 | 13:20 |
df.info()
<class 'pandas.core.frame.DataFrame'>
RangeIndex: 8 entries, 0 to 7
Data columns (total 5 columns):
 #   Column    Non-Null Count  Dtype
---  ------    --------------  -----
 0   Title     8 non-null      object
 1   Views     8 non-null      int64
 2   Likes     8 non-null      int64
 3   Comments  8 non-null      int64
 4   Duration  8 non-null      object
dtypes: int64(3), object(2)
memory usage: 452.0+ bytes
| Views | Likes | Comments | |
|---|---|---|---|
| count | 8.000000 | 8.000000 | 8.000000 |
| mean | 408600.000000 | 29450.000000 | 2592.750000 |
| std | 265469.142678 | 23624.563488 | 1097.964057 |
| min | 123000.000000 | 8200.000000 | 1203.000000 |
| 25% | 239225.000000 | 14525.000000 | 1831.000000 |
| 50% | 332750.000000 | 20600.000000 | 2473.000000 |
| 75% | 500750.000000 | 34925.000000 | 3139.000000 |
| max | 891000.000000 | 76000.000000 | 4589.000000 |
df.describe()
df.loc[df["Views"].idxmax()]
Title       Python for Beginners
Views                     891000
Likes                      76000
Comments                    4589
Duration                   25:00
Name: 2, dtype: object
df["Engagement"] = (df["Likes"] + df["Comments"]) / df["Views"]
df.sort_values("Engagement", ascending=False)
| Title | Views | Likes | Comments | Duration | Engagement | |
|---|---|---|---|---|---|---|
| 2 | Python for Beginners | 891000 | 76000 | 4589 | 25:00 | 0.090448 |
| 4 | Study With Me - 2hr Pomodoro | 710000 | 54200 | 3421 | 120:00 | 0.081156 |
| 3 | Room Tour 2025 | 123000 | 8200 | 1203 | 8:00 | 0.076447 |
| 1 | How to Focus Better | 431000 | 28500 | 3045 | 10:45 | 0.073190 |
| 7 | Q&A: Student Life | 194000 | 12200 | 1645 | 13:20 | 0.071366 |
| 5 | My Daily Routine | 276500 | 17400 | 2145 | 9:50 | 0.070687 |
| 6 | Productive Morning Routine | 389000 | 23800 | 2801 | 11:00 | 0.068383 |
| 0 | Study Vlog - 1 | 254300 | 15300 | 1893 | 12:30 | 0.067609 |
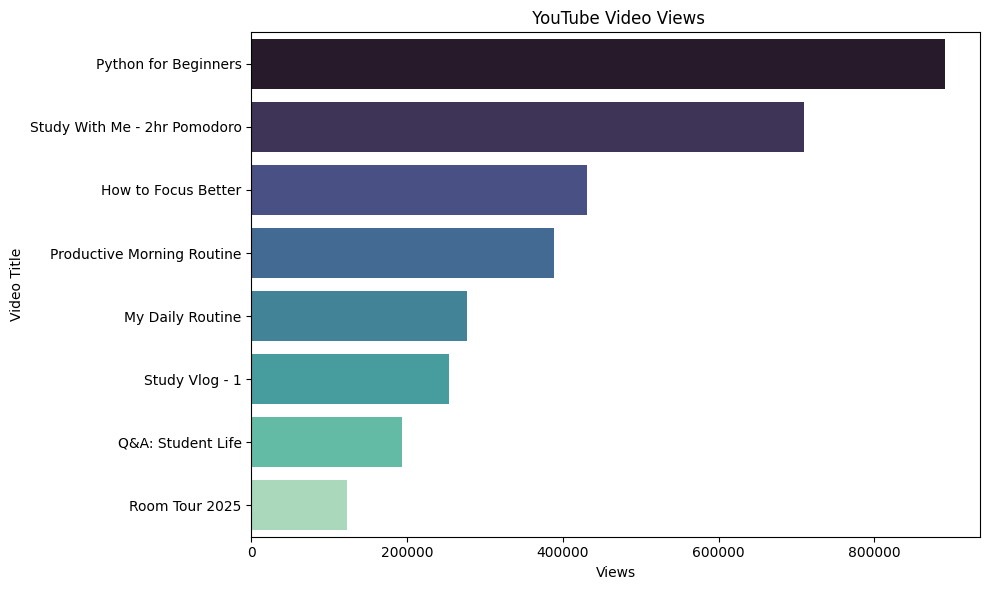
plt.figure(figsize=(10,6))
sns.barplot(data=df.sort_values("Views", ascending=False), x="Views", y="Title", palette="mako")
plt.title(" YouTube Video Views")
plt.xlabel("Views")
plt.ylabel("Video Title")
plt.tight_layout()
plt.show()
C:\Users\HP\AppData\Local\Temp\ipykernel_16092\1895900681.py:2: FutureWarning:

Passing `palette` without assigning `hue` is deprecated and will be removed in v0.14.0. Assign the `y` variable to `hue` and set `legend=False` for the same effect.

  sns.barplot(data=df.sort_values("Views", ascending=False), x="Views", y="Title", palette="mako")
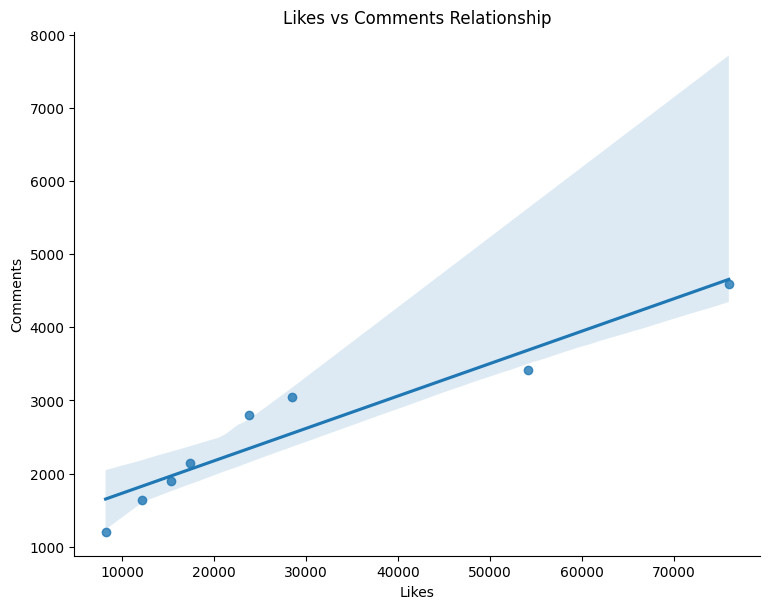
sns.lmplot(data=df, x="Likes", y="Comments", height=6, aspect=1.3)
plt.title("Likes vs Comments Relationship")
Text(0.5, 1.0, 'Likes vs Comments Relationship')
Score: 5
Category: pandas-work