Unemploymentanalysis
Mon 30 June 2025
import pandas as pd
import matplotlib.pyplot as plt
import seaborn as sns
data = pd.read_csv(r"C:\Users\HP\Desktop\OIB-SIP\unemploymentanalysis\unemployment\Unemployment in India.csv")
print("Data Shape:", data.shape)
Data Shape: (768, 7)
print("\nFirst 5 Rows:\n", data.head())
First 5 Rows:
            Region         Date  Frequency   Estimated Unemployment Rate (%)  \
0  Andhra Pradesh   31-05-2019    Monthly                              3.65
1  Andhra Pradesh   30-06-2019    Monthly                              3.05
2  Andhra Pradesh   31-07-2019    Monthly                              3.75
3  Andhra Pradesh   31-08-2019    Monthly                              3.32
4  Andhra Pradesh   30-09-2019    Monthly                              5.17

    Estimated Employed   Estimated Labour Participation Rate (%)   Area
0           11999139.0                                     43.24  Rural
1           11755881.0                                     42.05  Rural
2           12086707.0                                     43.50  Rural
3           12285693.0                                     43.97  Rural
4           12256762.0                                     44.68  Rural
print("\nColumn Names:", data.columns)
Column Names: Index(['Region', ' Date', ' Frequency', ' Estimated Unemployment Rate (%)',
       ' Estimated Employed', ' Estimated Labour Participation Rate (%)',
       'Area'],
      dtype='object')
print("\nMissing Values:\n", data.isnull().sum())
Missing Values:
 Region                                      28
 Date                                       28
 Frequency                                  28
 Estimated Unemployment Rate (%)            28
 Estimated Employed                         28
 Estimated Labour Participation Rate (%)    28
Area                                        28
dtype: int64
print("\nInfo:\n")
Info:

<class 'pandas.core.frame.DataFrame'>
RangeIndex: 768 entries, 0 to 767
Data columns (total 7 columns):
 #   Column                                    Non-Null Count  Dtype
---  ------                                    --------------  -----
 0   Region                                    740 non-null    object
 1    Date                                     740 non-null    object
 2    Frequency                                740 non-null    object
 3    Estimated Unemployment Rate (%)          740 non-null    float64
 4    Estimated Employed                       740 non-null    float64
 5    Estimated Labour Participation Rate (%)  740 non-null    float64
 6   Area                                      740 non-null    object
dtypes: float64(3), object(4)
memory usage: 42.1+ KB
None
print(data.info())
print("\nDescription:\n", data.describe())
Description:
        Estimated Unemployment Rate (%)  Estimated Employed  \
count                       740.000000        7.400000e+02
mean                         11.787946        7.204460e+06
std                          10.721298        8.087988e+06
min                           0.000000        4.942000e+04
25%                           4.657500        1.190404e+06
50%                           8.350000        4.744178e+06
75%                          15.887500        1.127549e+07
max                          76.740000        4.577751e+07

       Estimated Labour Participation Rate (%)
count                               740.000000
mean                                 42.630122
std                                   8.111094
min                                  13.330000
25%                                  38.062500
50%                                  41.160000
75%                                  45.505000
max                                  72.570000
data.columns = ['Region', 'Date', 'Frequency', 'Estimated Unemployment Rate',
                'Estimated Employed', 'Estimated Labour Participation Rate', 'Area']
data['Date'] = pd.to_datetime(data['Date'])
C:\Users\HP\AppData\Local\Temp\ipykernel_21812\1453708669.py:1: UserWarning: Parsing dates in  %d-%m-%Y format when dayfirst=False (the default) was specified. Pass `dayfirst=True` or specify a format to silence this warning.
  data['Date'] = pd.to_datetime(data['Date'])
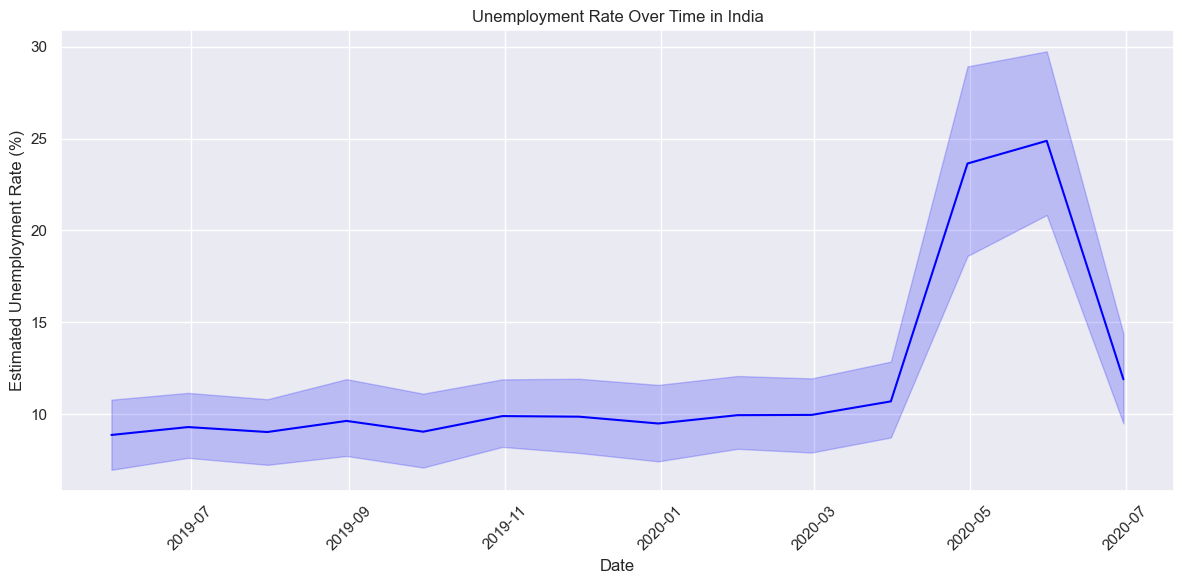
sns.set(style="darkgrid")
plt.figure(figsize=(12, 6))
sns.lineplot(x='Date', y='Estimated Unemployment Rate', data=data, color='blue')
plt.title('Unemployment Rate Over Time in India')
plt.xlabel('Date')
plt.ylabel('Estimated Unemployment Rate (%)')
plt.xticks(rotation=45)
plt.tight_layout()
plt.show()
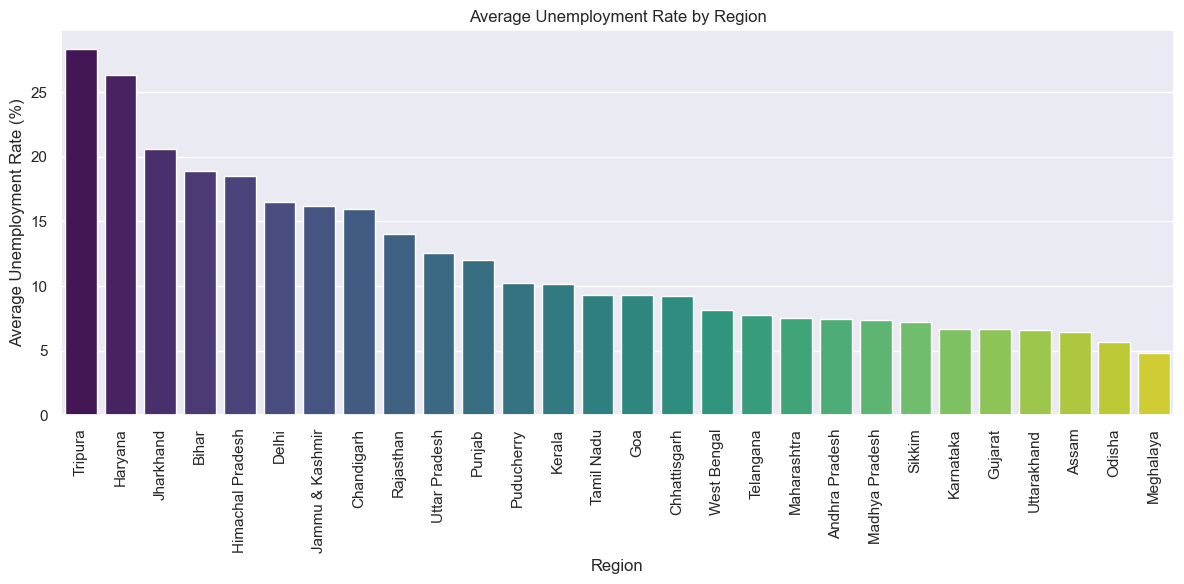
plt.figure(figsize=(12, 6))
region_avg = data.groupby('Region')['Estimated Unemployment Rate'].mean().sort_values(ascending=False)
sns.barplot(x=region_avg.index, y=region_avg.values, palette='viridis')
plt.title('Average Unemployment Rate by Region')
plt.xlabel('Region')
plt.ylabel('Average Unemployment Rate (%)')
plt.xticks(rotation=90)
plt.tight_layout()
plt.show()
C:\Users\HP\AppData\Local\Temp\ipykernel_21812\2984665358.py:3: FutureWarning:

Passing `palette` without assigning `hue` is deprecated and will be removed in v0.14.0. Assign the `x` variable to `hue` and set `legend=False` for the same effect.

  sns.barplot(x=region_avg.index, y=region_avg.values, palette='viridis')
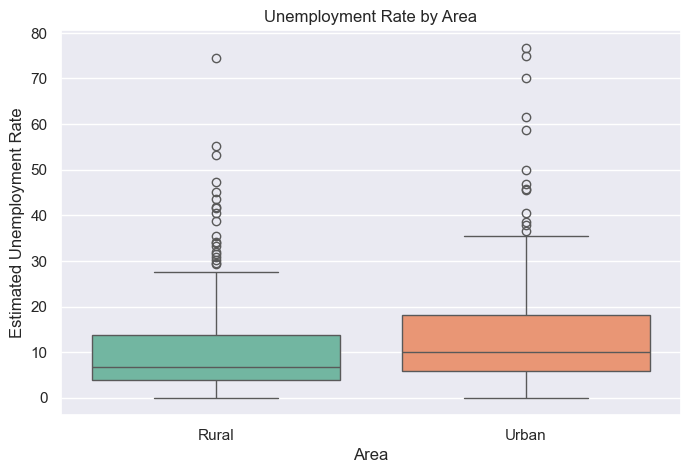
plt.figure(figsize=(8, 5))
sns.boxplot(x='Area', y='Estimated Unemployment Rate', data=data, palette='Set2')
plt.title('Unemployment Rate by Area')
plt.show()
C:\Users\HP\AppData\Local\Temp\ipykernel_21812\1027203389.py:2: FutureWarning:

Passing `palette` without assigning `hue` is deprecated and will be removed in v0.14.0. Assign the `x` variable to `hue` and set `legend=False` for the same effect.

  sns.boxplot(x='Area', y='Estimated Unemployment Rate', data=data, palette='Set2')
Score: 15
Category: pandas-work