Student Analysis
Mon 30 June 2025
import pandas as pd
from io import StringIO

data = """Name,Math,Physics,Chemistry
Sara,88,92,85
Ali,76,81,79
Afia,95,90,96
John,55,60,58
Lina,66,74,70"""

df = pd.read_csv(StringIO(data))
df
| Name | Math | Physics | Chemistry | |
|---|---|---|---|---|
| 0 | Sara | 88 | 92 | 85 |
| 1 | Ali | 76 | 81 | 79 |
| 2 | Afia | 95 | 90 | 96 |
| 3 | John | 55 | 60 | 58 |
| 4 | Lina | 66 | 74 | 70 |
df['Total'] = df[['Math', 'Physics', 'Chemistry']].sum(axis=1)
df['Average'] = df['Total'] / 3
df['Result'] = df[['Math', 'Physics', 'Chemistry']].apply(lambda row: 'Pass' if (row >= 40).all() else 'Fail', axis=1)
df
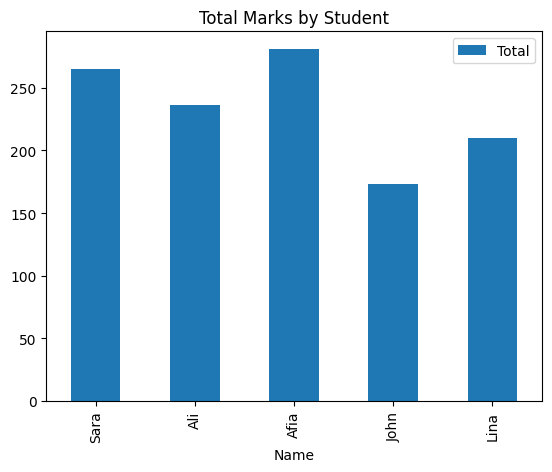
| Name | Math | Physics | Chemistry | Total | Average | Result | |
|---|---|---|---|---|---|---|---|
| 0 | Sara | 88 | 92 | 85 | 265 | 88.333333 | Pass |
| 1 | Ali | 76 | 81 | 79 | 236 | 78.666667 | Pass |
| 2 | Afia | 95 | 90 | 96 | 281 | 93.666667 | Pass |
| 3 | John | 55 | 60 | 58 | 173 | 57.666667 | Pass |
| 4 | Lina | 66 | 74 | 70 | 210 | 70.000000 | Pass |
import matplotlib.pyplot as plt

df.plot(x='Name', y='Total', kind='bar', title='Total Marks by Student')
plt.show()
Score: 0
Category: pandas-work