Salesprediction
Mon 30 June 2025
import pandas as pd
import numpy as np
import matplotlib.pyplot as plt
import seaborn as sns
from sklearn.model_selection import train_test_split
from sklearn.linear_model import LinearRegression
from sklearn.metrics import mean_squared_error, r2_score
data = pd.read_csv(r'C:\Users\HP\Desktop\OIB-SIP\salesprediction\dataset\Advertising.csv')
print("First 5 rows of the dataset:")
First 5 rows of the dataset:
   Unnamed: 0     TV  Radio  Newspaper  Sales
0           1  230.1   37.8       69.2   22.1
1           2   44.5   39.3       45.1   10.4
2           3   17.2   45.9       69.3    9.3
3           4  151.5   41.3       58.5   18.5
4           5  180.8   10.8       58.4   12.9
print(data.head())
print("\nChecking for missing values:")
Checking for missing values:
Unnamed: 0    0
TV            0
Radio         0
Newspaper     0
Sales         0
dtype: int64
print(data.isnull().sum())
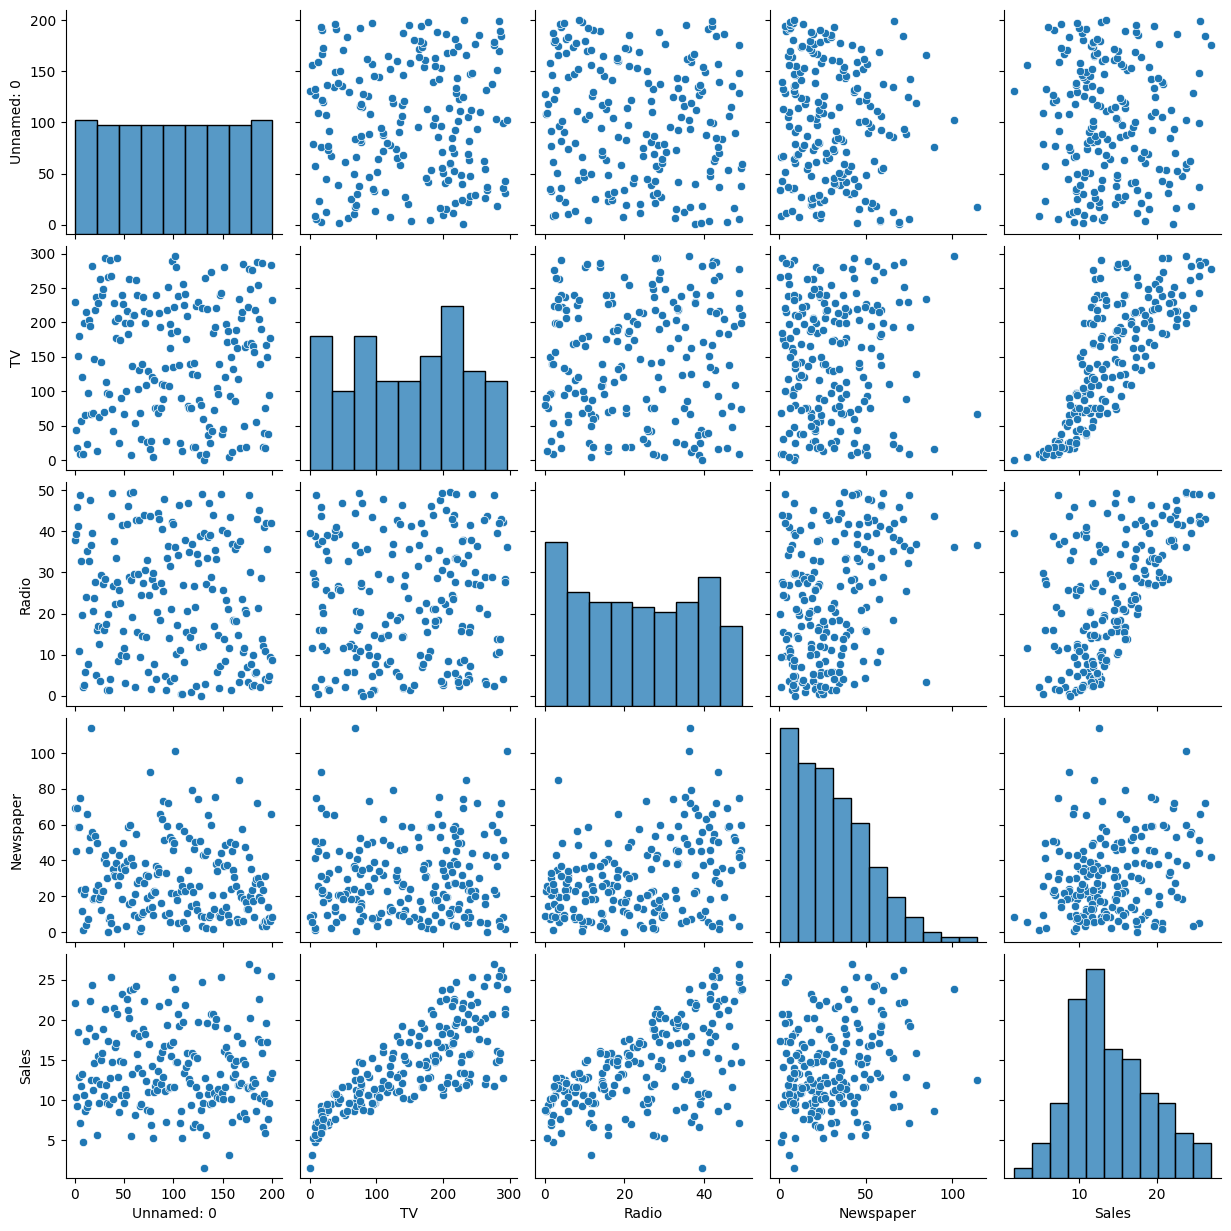
sns.pairplot(data)
plt.show()
X = data[['TV', 'Radio', 'Newspaper']]
y = data['Sales']
X_train, X_test, y_train, y_test = train_test_split(X, y, test_size=0.2, random_state=42)
model = LinearRegression()
model.fit(X_train, y_train)
LinearRegression()In a Jupyter environment, please rerun this cell to show the HTML representation or trust the notebook.
On GitHub, the HTML representation is unable to render, please try loading this page with nbviewer.org.
LinearRegression()
y_pred = model.predict(X_test)
mse = mean_squared_error(y_test, y_pred)
r2 = r2_score(y_test, y_pred)
print(f"\nMean Squared Error: {mse:.2f}")
print(f"R-squared Score: {r2:.2f}")
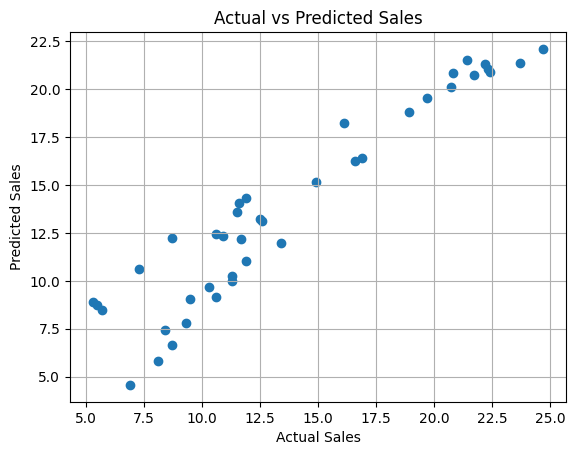
Mean Squared Error: 3.17
R-squared Score: 0.90
plt.scatter(y_test, y_pred)
plt.xlabel("Actual Sales")
plt.ylabel("Predicted Sales")
plt.title("Actual vs Predicted Sales")
plt.grid(True)
plt.show()
Score: 15
Category: pandas-work