Matplotlib Demo
Mon 30 June 2025
import matplotlib.pyplot as plt
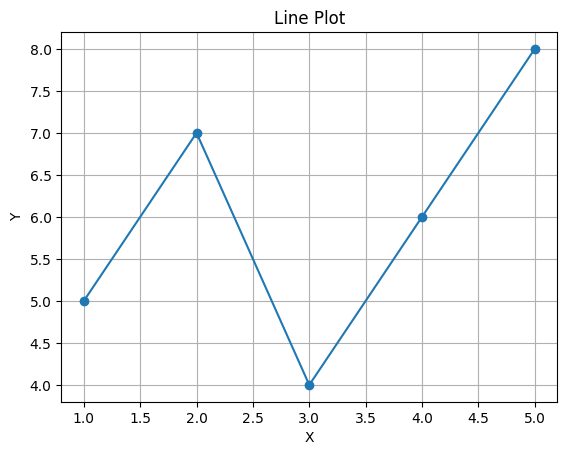
x = [1, 2, 3, 4, 5]
y = [5, 7, 4, 6, 8]
plt.plot(x, y, marker='o')
plt.title("Line Plot")
plt.xlabel("X")
plt.ylabel("Y")
plt.grid(True)
plt.show()
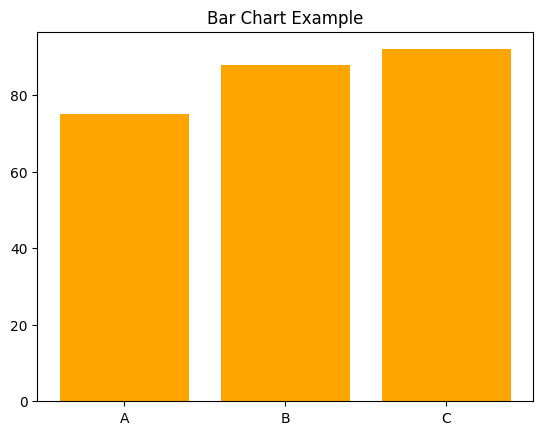
names = ["A", "B", "C"]
scores = [75, 88, 92]
plt.bar(names, scores, color="orange")
plt.title("Bar Chart Example")
plt.show()
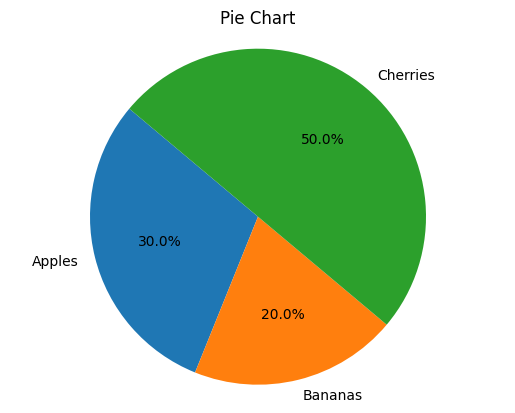
sizes = [30, 20, 50]
labels = ["Apples", "Bananas", "Cherries"]
plt.pie(sizes, labels=labels, autopct='%1.1f%%', startangle=140)
plt.axis("equal")
plt.title("Pie Chart")
plt.show()
Score: 5
Category: basics